|
|
PureBasic
Survival Guide XI - Debugger
|
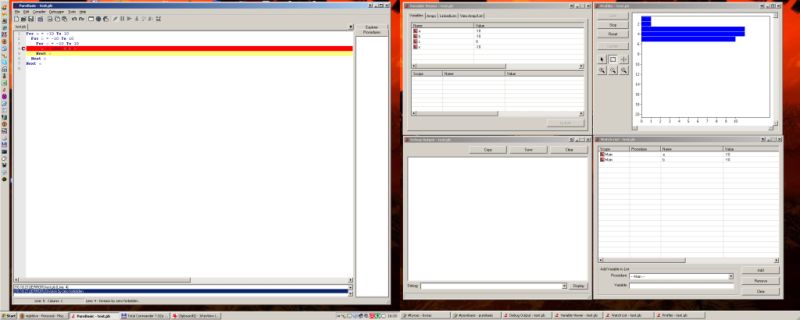
Debuggers are an interesting aspect of programming. They're supposed to help you finding and solving bugs. Without a doubt debuggers are one of the fields where developers of programming languages put a lot of effort in. It's a pity though that users may not always appreciate them. Then again, in a perfect world, all our code should be bug-free :-) The following picture shows my old setup (using an older PureBasic 4.xx version, don't recall which one) using two screens at 1280x1024 next to each other. On the left screen there's the main PureBasic Editor window, on the right screen you'll spot four smaller windows:
I strongly advise a dual monitor setup. Programming is a lot more fun if you have sufficient screen real estate :-) The experts may notice the continuous taskbar, which is visible on both monitors. You can either use MultiMon (free) or UltraMon (not free but better). Another nice tool is WinSplit for those that prefer a single large screen over a dual monitor setup, or use Windows 8. Since then the debugger has seen some serious changes... And I haven't got a clue about all options and possibilities but small wonder, as first I'm not that good, and second in 4.51 we now have 10 (!) different windows all related to the debugger... In a perfect world, all our code should be bug-free. In reality, it never is. Debugging is supposed to make your life easier. Sometimes it actually does. But you need to know how to set it up :-) Turning
the debugger on / off is simply done through the 'Use Debugger' icon in
the toolbar. For all other settings, go to File / Preferences / Debugger.
(It would be nice to have a few shortcuts to toggle the different debugger
windows, but alas...) Here are my settings (though they tend to change):
Bringing up the debugger and its windows First of all, do not forget to turn the debugger on, either via Debugger / Use Debugger, or with the 'Use Debugger' button on the toolbar. When you're editing, you will see that the 'Kill Program' button on the toolbar stays grey. Once your program runs, it turns red and you can click on it to kill your program. The buttons directly left of it allow you to halt your program, step through it line by line, or continue normally. There are two ways to bring up the debugger windows:
First the easy approach: code an error, turn the debugger on, watch it in action :-) ; pb 4.50An error is shown at the bottom of the PB IDE. Obviously the error would not be caught with the debugger disabled, and your program would crash. Disable the debugger for a section of the source You can selectively disable the debugger for sections of your code: DisableDebuggerObviously, it would be unwise to comment out any errors :-) so here's a working example, there's no problem disabling the working section of the code, but we do want to catch the 'divide by zero':: ; pb 4.50 Breakpoints There are three controlled ways to halt the execution of your program through the source. The first one is adding the following command to your source code: CallDebuggerThis will halt your program at that specific place in your code. You can then use all debugger features and windows, and go step by step through your code. The
second method is simply pressing [F9] on any line in the editor. This would
add a breakpoint to your code. You can clear these breakpoints by hitting
[F9] again. Execution of your program will halt on the line with the breakpoint,
just before executing the code on that line.
Stepping through When your program is halted you can use any of the open debugger windows, abort, continue running your program, or even step through your program, using the icons in the PB IDE button bar (Stop, Continue, Step, etc.). On every step, the debugger windows are updated. The third way is by adding a conditional breakpoint, in PureBasic called a 'Data Breakpoint'. CallDebuggerEnter and run the code above. It will immediately stop at the first line with CallDebugger. Now go to Debugger / Data Breakpoints, and fill in the conditon a = 17 and hit the 'Add' button. This will tell the debugger to halt your code the moment the variable a reaches the value 17. Now hit the 'continue' button (round button in the IDE itself looking like a 'play' symbol). Your code will continue, then stop when the variable a reaches the value of 17 In all these cases any debugger windows that are open (especially the Variable Viewer) will be updated the moment execution stops. Remember
that you can define which debugger windows open when starting your code
using File / Preferences / Debugger / Default Windows.
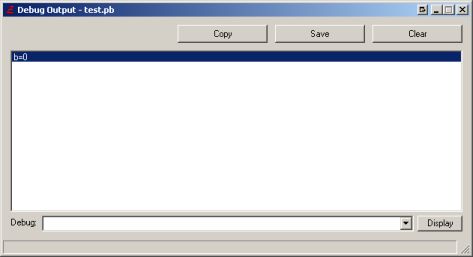
Messages to the Debug Output window You can also send messages to the Debug Output window using the Debug command. Debug "debugging..."The Debug command has some quirks... more about that in the next section. In a perfect world, all our code should be bug-free... In reality, it (probably) never is. Let's start with an image of the 'Debug Output' window. This window will be shown whenever we send something to it using the Debug statement. First, make sure you have enabled the debugger through the menu Debugger / Use Debugger, and run the following complex code: b = 0You should get an error message, but the debugger window may not open... Yet the debugger is doing its job. Look at the bottom of the editor, you should see something like: [16:46:14] [ERROR] Division by zero forbidden.If you try to run the same program with the debugger switched off, you'll get Windows throwing a warning at ya'... Unless you were running Windows 98, in which case you may either have to reboot... or Windows does that for you ;-) Let's assume we'd like to know what actually caused the crash, we'd like to know what value b has. With the debugger enabled, we can output the value of the varable b to a special debugger window: b = 0In the window 'Debug Output' we'll see the content of variable b, which is (big surprise) zero. A small variation would look like this: b = 0The command Debug can only display variables, numbers, or strings, so we created our own string using Str(). Here's how the Debug Output window looks like:
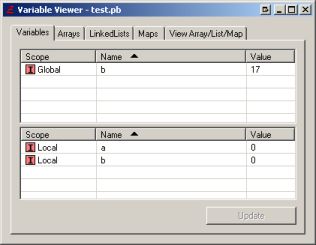
As you can see, you can put pretty much anything behind a Debug statement, but keep in mind it's only executed with the compiler switched on! Try the following with debugger on and debugger off: Global aIncA() is only executed with the debugger ON. If the debugger is switched off, the line will not be executed at all. A second thing to keep in mind is that new values are NOT assigned to a variable when using the Debug statement. This can cause very hard to trace bugs, which are (frankly) caused by our own stupidity... Let's say we wrote the following code, which works fine with and without the debugger (always shows 2)... a = 1Now, for some reason, we'd like to know the value of a, so smart (and lazy!) as we are, we add the Debug statement like this: a = 1... and suddenly the output stays 1, no matter what! To avoid these kind of problems it's better to do it like this: a = 1 Do not confuse this one with the 'other' Variable Viewer which is accessible through the menu Tools / Variable Viewer. The debugger Variable Viewer window shows the values of all variables, arrays and linked lists in your program. The top section lists all variables that are in the 'root' of your program (ie. not declared inside a procedure) and those that are declared global (regardles if that has been done in- or outside a procedure). The bottom section lists all locally (within a procedure) declared variables which are non-global. Duh. That's confusing :-) Let's try that again... The bottom section lists everything defined within a procedure, with the exception of the Global keyword. The top section lists the rest. Duh. Still confusing :-) Here's an example, run this and you will see an error: Procedure abc()Go into the IDE's menu and pick Debugger / Variable Viewer. The following window will pop up:
On the top half you'll find a list of global variables, the bottom half shows the local variables. See the PureBasic help file for what the coloured icons mean. Note that the Variable Viewer is NOT real-time. It will only update on a breakpoint, or when stepping through your code with the debugger, or if you hit the 'Update' button. You can check that by running the code below. CallDebuggerFirst run it. The first line with CallDebugger will switch to 'step' mode so you can step through your code line by line. Your code is now paused until you tell it to continue using the 'Step' button in the IDE (the first round button with a little arrow pointing right). Now
bring up the Variable Viewer window via Debugger / Variable VIewer, then
use the 'Step' button on the IDE toolbar to step through your code. Watch
the value of your variable a change every time it passes the line a = a+1.
Now hit the 'continue' button on the IDE's toolbar. Though your code is
running, nothing seems to happen. If you hit the Update button you'll see
how fast a has been increasing! If you want realtime updates use the Watch
List.
Viewing variable values in the source You can use the Debugger's Variable Viewer, but there is another way to find the value of a variable whilst running your code. First enter the code below: Structure yNow run this code, then click somewhere in your source code and then hover with your mouse pointer over the variable 'a'. Move the pointer away, then back over the variable a, and you can see how it increases. If you hover over the 'a' part of 'x\a' the IDE will show you the value of 'a', it doesn't recognize that the 'a' in this case is part of the structured variable x. Let the code run, but mark the part 'x\a' in the source code, and hover your mouse over the marked part, and the IDE will show you the value of x\a. Leave
the code running, but now mark in line 8 the 'x.y' part, and hover the
mouse over it. The IDE will then show all fields of the structured variable
x, and their values.
Don't forget to check out PureBasic's help-file! The Watch List window serves pretty much the same purpose as the Variable Viewer window, but it's realtime. First have the debugger open up the Variable Viewer and Watch List windows by default by going into File / Preferences / Debugger / Default Windows, then run the code below. a = 1You can add variables to the Watch List. Add the variable 'a' and the Watch List will show you the value of 'a' in real-time. The Variable Viewer will only update if you're in 'step' mode, or if you hit the Update button. A little trick to make it easier adding variables is to add a breakpoint [F9] to the line where your variable is first used or defined. Then, when the debugger halts on that line, you pick the proper variable in the Variable Viewer and add it to the Watch List. In 4.20 you couldn't watch strings in real time, but in 4.51 you can! The Memory Viewer allows a quick peek at an area in memory. Unfortunately it does not automatically update, and you're only allowed to monitor one specific area. It's probably best used in combination with breakpoints. It may often be faster to use a Debug statement and some code of your own making. An interesting aspect of the memory viewer is its support of (certain) expressions... Run the following: a.s = "Abracadabra"... then bring up the Memory Viewer, and set range to @a... and hit 'Display'. I tried @ and Len() and the regular +-/* and they were supported. Note: you have to enter a 'range'. Here's how not to do it: @aThe above would specify a range from @a (whereever that would be in memory) up to (absolute) memory location number 5. If you want to disply 5 bytes, you should use: @aThe '+5' would in effect display @a to @a+5, which is what I wanted. Yep, I did fall in that trap myself :-( The Profiler in 4.20 shows a graph with all lines in your code. Every time a line is executed, it increases a counter. You can easily spot what part of your code has been executed most. Note that this only counts the number of times a line has executed, it does not show how much TIME that line, section of code, or procedure, has taken. I hate debugging! Unfortunately, sometimes one doesn't have a choice. One of my ongoing projects is CodeCaddy, which has seen several incarnations since 2005. With the arrival of PureBasic 4.31 I decided to convert it to full Unicode (okay, mostly Unicode, but at least enough to make it work :-))... CodeCaddy relies heavily on my 'shared include' called x_lib.pb (which is simply a collection of procedures that I often use, and it's included with the CodeCaddy source). I've tried to rewrite the x_lib file in such a way that it would work with current and future versions of PureBasic, on 32 and 64 bit platforms. (As I don't have a 64 bit setup here I couldn't test the latter, sorry.) Whilst doing that, I cleaned up some things, removed old stuff, shuffled some parameters, and did other things I should not have done. The end result: CodeCaddy wouldn't work with the new and updated x_lib unless I did a major rewrite on CodeCaddy as well... So be it. So I started updating / rewriting CodeCaddy to use the x_lib, and to become Unicode aware. And another week passed by... Whilst I suffered all stages of ever so painful debugging. Some were caused by converting from 3.81 to 4.xx to 4.31, some were caused by moving from Ascii to Unicode... Some were logic mistakes (and those are the worst) that for some reason did not show up before, or (even worse) that did show up but disappeared again... to re-appear again... So, how do you make your life less painful? Why am I bringing this up? Debugging, in any form, can be painful. Very painful. So here are some tips to make it easier...
Regression bugs With a collection of routines that interact and depend on each other, each rewrite / improvement / bugfix may break something else elsewhere in your code. So what I've started doing is write a program that uses each and every procedure from my 'shared include', with different parameters and verifying the output. Every time I run into a bug I add another test to that test-program. With every new release of PureBasic, or every change in the 'shared include' I run my test program again, testing, testing, testing. And by doing so I uncovered a number of bugs that fixed my issues with CodeCaddy, but I also ran into (and fixed!) serveral bugs I was not even aware of, but which might have caused me serious problems in future versions of CodeCaddy, or in other projects. Morale?
Test. Test. Test.
|


|
|